

The vulnerable dollar.
The US has managed to fund a large external imbalance due to its perceived exceptionalism. With this now much diminished, the US dollar looks set to undergo a long and slow slide lower.

Last week, the US Bureau of Economic Analysis released the Balance of Payments and International Investment Position of the United States for the period 2025 (Q3). Balance of payments data typically passes without so much as a mention in the mainstream media and is usually ignored by Wall Street, but it has significant potential implications for investors whether they’re aware, or not.
The three key takeaways are:
The US current account deficit is substantial, in the region of USD 1,130bn (3.7% of GDP) last year and likely to be broadly similar this year. Under a floating exchange rate regime, the current account deficit will be financed by an offsetting capital inflow. But willingness to finance the deficit is likely to be reduced due to increased geo-political/economic uncertainty and the perception of a loss of US exceptionalism, weighing on the US dollar,
The scale of US external liabilities is vast with net liabilities totaling USD 27.61 trillion (88.8% of GDP), with gross liabilities a whopping USD 68.9 trillion (221.5% of GDP). Increased geo-political risk, loss of confidence in the integrity of US policymaking, and/or a deterioration in expected returns means that even a modest shift in portfolio balances – either directly or synthetically via FX hedging – has the potential to trigger hundreds of billions of US dollar selling.
Given the US dollar’s role as global reserve currency, it’s hard to see how the US experiences a ‘sudden stop’ in capital flows as in Indonesia, South Korea, or Thailand in 1997. The sudden withdrawal of foreign private capital from US capital markets would likely trigger at least partially offsetting buying from foreign Central Banks as they work to moderate their own currency’s appreciation (there’s evidence this is already happening in Asia). And if we were to experience a full ‘flight-to-quality’ outflow of private sector funds from US capital markets, a spike in risk aversion would likely trigger buying of US dollars by borrowers as they square-out loans (e.g. in the cross-currency swap market). In the post-GFC world, we’ve also seen the US Federal Reserve step in by providing US dollar swap line facilities to foreign central banks, reducing the need for foreigners to have to purchase US dollars directly in illiquid FX markets.
So, while the US dollar may not experience an EM-style collapse, insulated by its role as global reserve currency (as was the case in 2007/08), loss of foreign investor confidence in US capital markets would be more keenly felt in the credit and equity markets. This suggests the most likely outcome for US dollar weakness is a prolonged period of decline as was the case in the late 1970s, late 1980’s and mid-2000s.
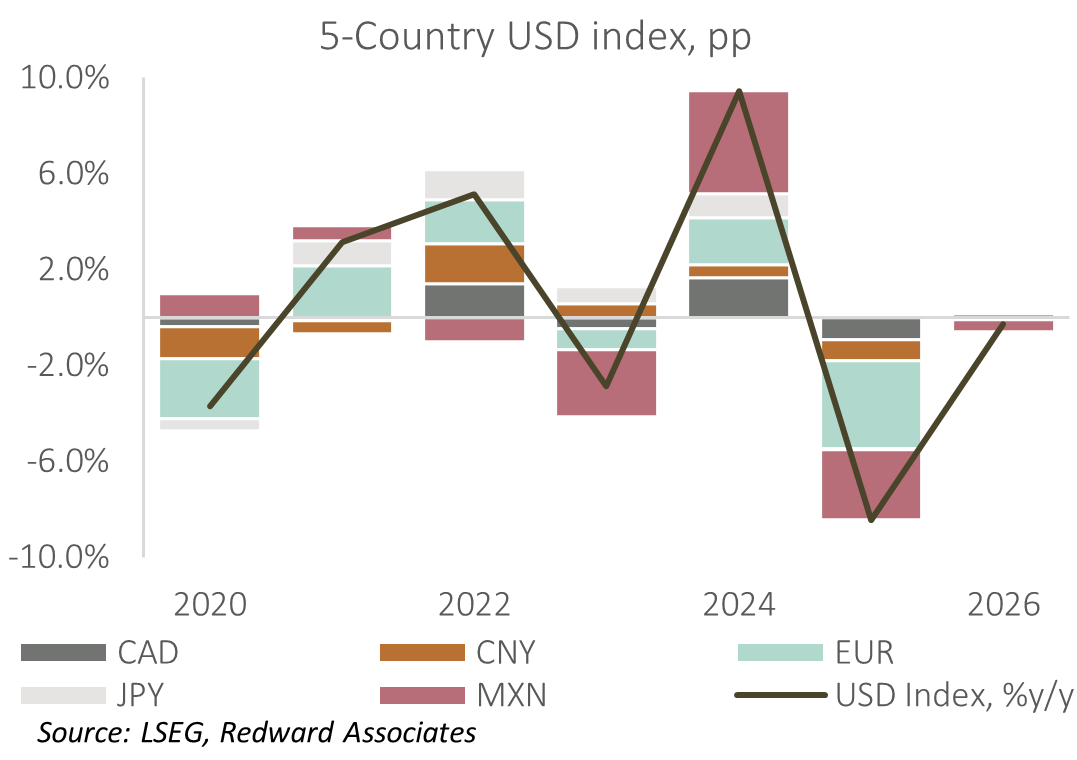
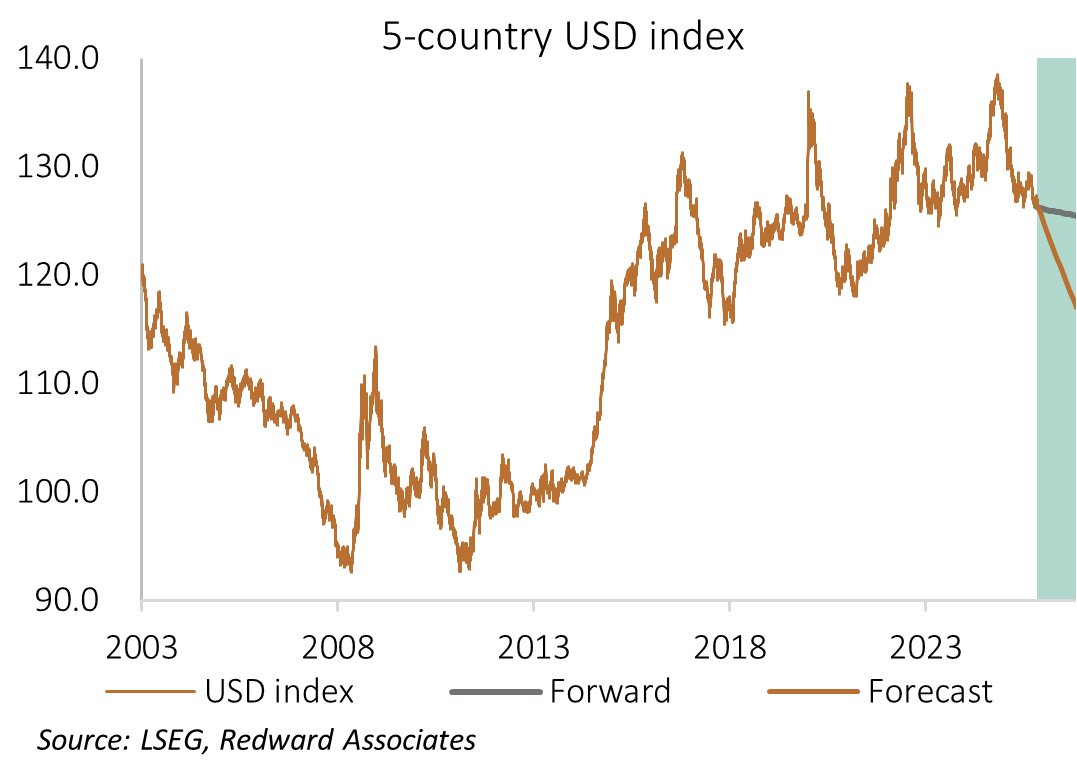
The US dollar peaked a year ago.
Rather than look at the popular US dollar index (DXY) which is highly European-centric, I prefer a 5-country basket based on the euro, yen, renminbi, Canadian dollar, and Mexican peso. Based on this basket, the US dollar peaked on the 10th of January 2025 and has subsequently declined 8.6%. Since the end of 2024 the US dollar index has weakened 8.5% driven largely by the EUR (3.4pp), MXN (3.4pp), CNY (1.0pp), CAD (0.8pp) while the JPY (-0.1pp) has been steady.
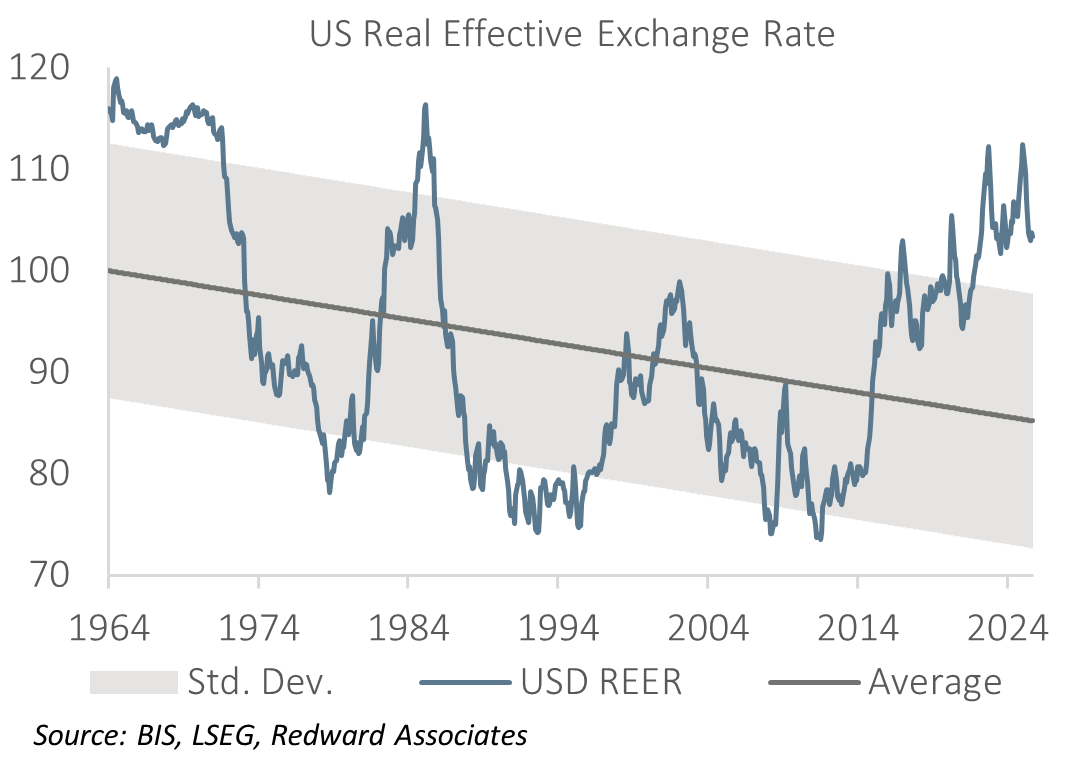
While the US dollar has fallen from its pre-Inauguration high, it remains around 20% above its long-term (1964-2026) downtrend on a broad real effective exchange rate basis (BIS data).
The US needs more than USD 1 trillion dollars to fund its C/A deficit.
The massive tariff hike…
The Yale Budget Lab estimate that as of the 19th of January (prior to any Greenland tariffs) the overall average effective tariff rate consumers in the United States now face is 16.9%, it’s highest rate since 1932. This would increase to 17.5% if the Greenland tariffs are implemented. The increase in tariffs is likely to cause both income and substitution effects, with the Yale Budget Lab estimating that once income effects are factored in, the average effective tariff rate would drop to 14.3%.
…appears to be being absorbed by US consumers…
Such large tariffs should have a material negative impact on the US trade deficit, but it’s not clear this will occur for several reasons. Firstly, implementation of tariffs on commodities not produced in the US will lead to no trade adjustment – they’re merely a consumption tax so there may be an income effect, but not a substitution effect. Secondly, the elevated, volatile, and uneven implementation of tariffs is more likely to lead to trade diversion than trade substitution, and with a high degree of uncertainty surrounding the sustainability of the tariffs, business is likely to be sluggish in responding (building productive capacity in the US). So, the tariff is more likely to act as a consumption tax, something that is borne out by research conducted by the Kiel Institute, who report US consumers are paying 96% of the tariff.
…with the savings-investment balances…
National income accounting shows that the current account balance can be thought of as the difference between exports and imports or the difference between national savings and investment, with savings and investment typically broken down by households, business, and government. In their October Fiscal Monitor, the IMF forecast the US general government deficit widening to 7.9% of GDP this year (+0.5pp), suggesting that government dissaving is widening the current account deficit. Investment and savings data indicate the IT-spending boom is likely to be associated with increased corporate dissaving, leaving the adjustment to be borne by the household sector. It’s difficult to get a reliable reading on household investment, but the BEA reports the household savings rate has fallen to just 4%. Simply put, on a savings-investment basis, it’s hard to see any material adjustment to the current account deficit.
…suggesting no material change to the C/A deficit.
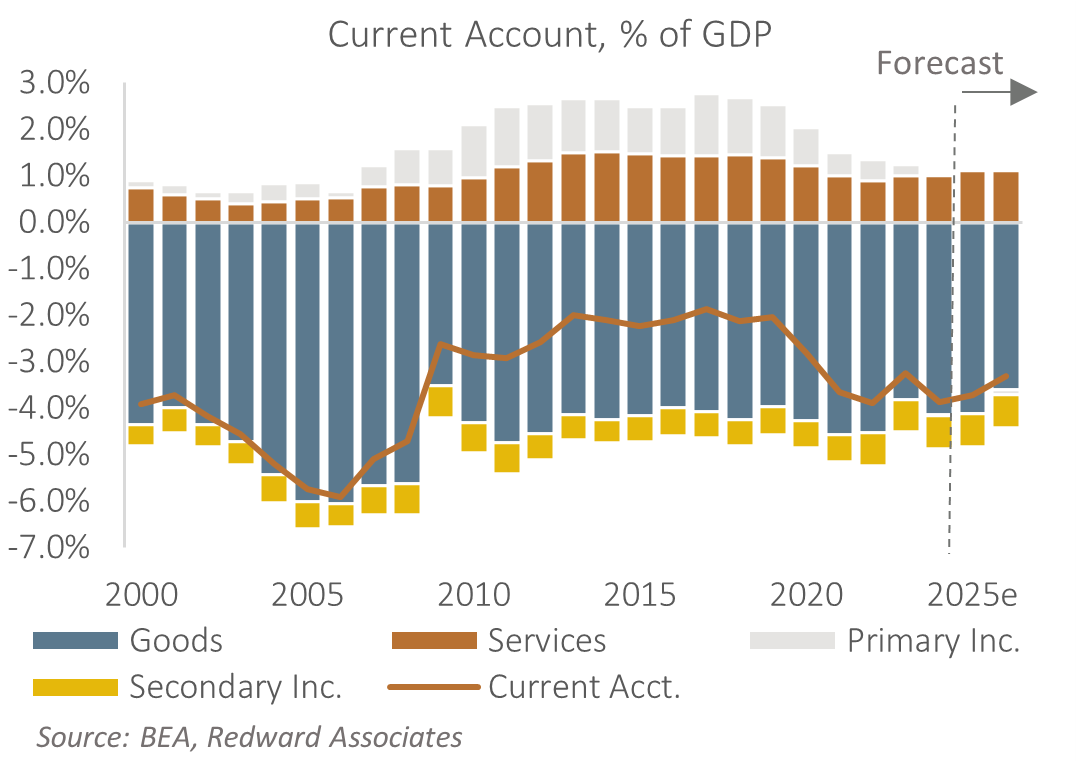
I project the US ran a current account deficit in the region of USD 1,130bn (3.7% of GDP) last year, with my initial projection suggesting a slightly smaller deficit this year at USD 1,050bn (3.3% of GDP), but this is due largely to leads-lags in purchases ahead of the tariff announcement in April 2025.
Foreigners have been willing buyers of US assets.
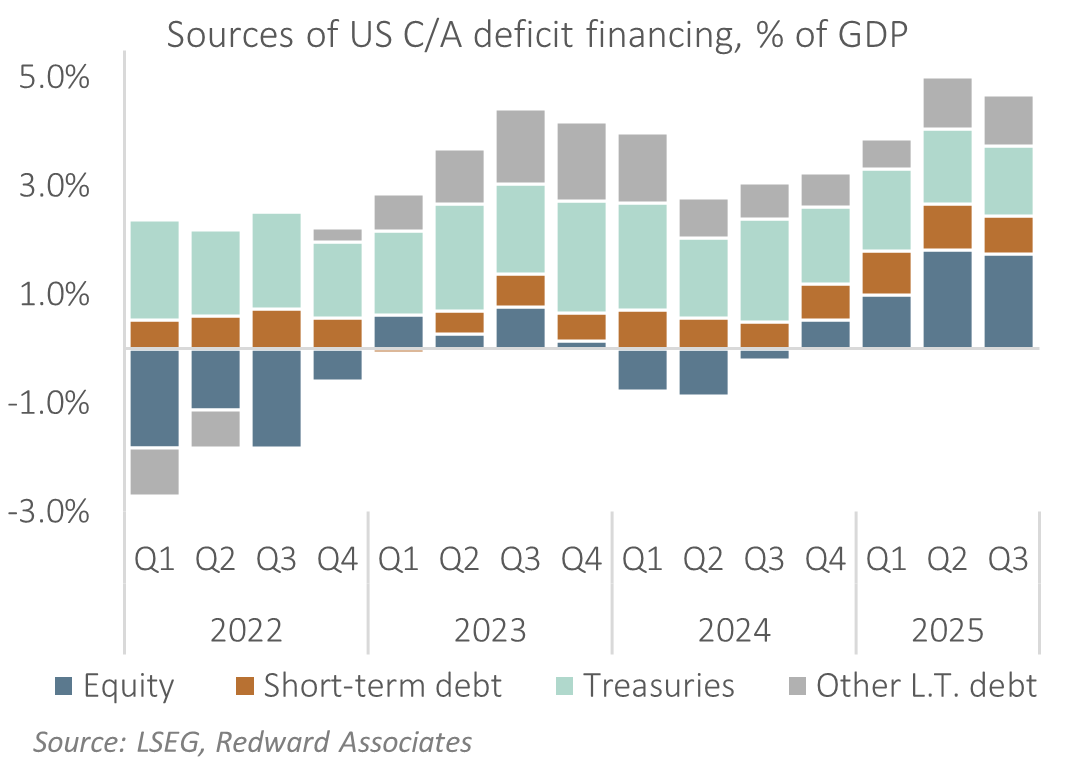
As the US operates a floating exchange rate regime, its current account deficit is matched by a capital and financial account surplus. Over the past year, net flows of direct investment, banking system flows (other investment) and financial derivatives have been modest, with the bulk of the US current account deficit financed by net portfolio capital inflows. Historically, the primary source of portfolio capital flow has been demand for a range of US fixed income instruments, Treasury bills and bonds, CDs and corporate bonds, and agency securities. While these remain the dominant source of funding, over the past year they’ve been joined by robust net portfolio equity inflows.
But their implicit USD forecast looks implausible
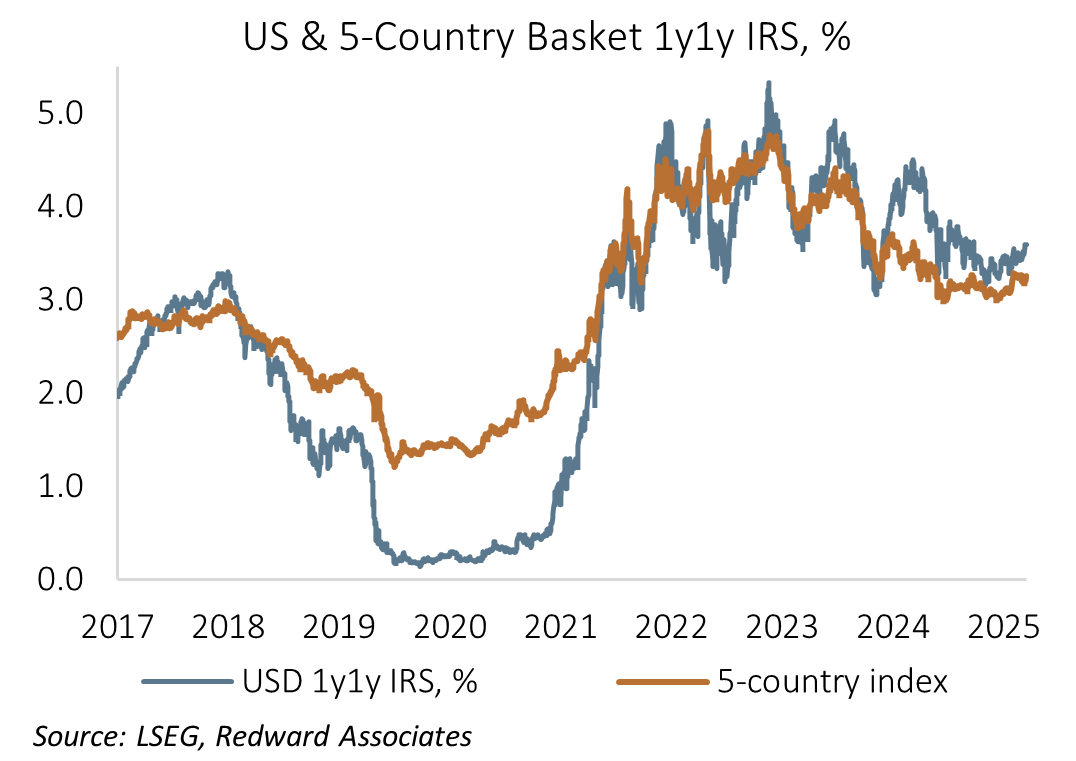
There are multiple factors supporting demand for US fixed income securities. Foreign Central Banks will purchase US bonds as part of their own foreign exchange management policies, commercial banks will hold US securities for macro-prudential reasons, and investors will hold them as part of their investment benchmark, subject to perceptions of return. While investors have multiple reasons for holding US dollars, ultimately, they come down to a view on expected return, or Uncovered Interest Parity, which states that foreign and domestic interest rates should equilibrate once expected exchange rate changes are factored in. Using the one-year interest rate swap one-year forward as an indicator, the yield differential between the US 1y1y IRS and its 5-country basket weighted equivalent is only around 35bp, minimal when one considers how expensive the US dollar is. Simply put, the limited yield differential suggests foreigners expect the US dollar to remain robust, which strikes me as improbable.
This isn’t the first time this has happened. In June 1985 Paul Krugman (NBER WP #1644) noted:
“the essential argument is that given the modest real interest rate differentials between the U.S. and its trading partners, the dollar’s strength amounts to an implicit forecast on the part of the market that with high probability the dollar will remain strong for an extended period.”
Dr Krugman then went on to show that the effect of this would be for the US to accumulate “Latin American levels of debt relative to GNP, which is presumably not feasible.” While this wasn’t feasible in the 1980’s, it proved to be feasible in recent years, as we will see below.
US exceptionalism?
Over the past twelve months the US balance of payments has been supported by robust net foreign demand for US equities as foreigners poured capital into the generative-AI theme. However, with S&P500 IBES 12-month forward earnings expectations elevated at 15.3%y/y and the 12-month forward PE ratio hovering around 22x, US equities are expensive. While investors have questioned a range of issues surrounding the generative-AI story – vendor financing, shadow banking, asset depreciation schedules and the ability to scale investment – the biggest challenge appears to come from insiders such as Gary Marcus who highlights diminishing returns to Large Language Models and questions their ability to be monetized.
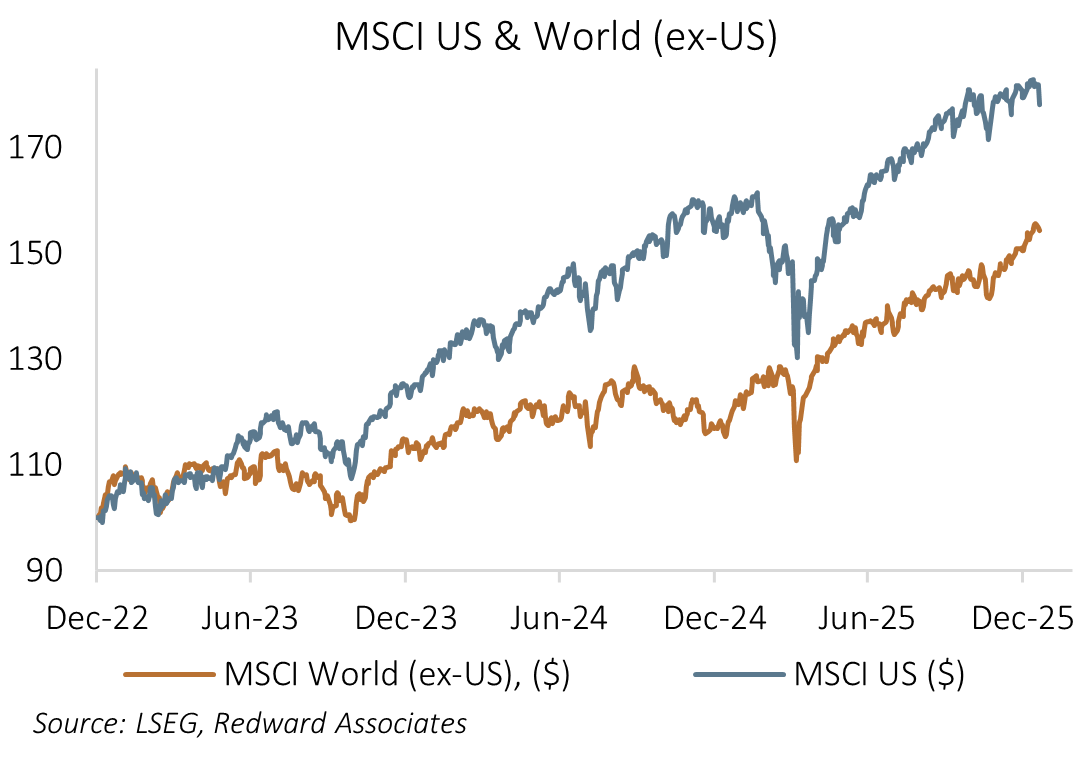
Despite near-euphoric levels of investor optimism (AAII Survey, Conference Board Survey, FINRA leverage data, BofA Fund Manager cash holdings, Put-Call ratio) the US equity market appears to be under-performing as evident in the performance of the MSCI US vs. the MSCI World (ex-US). Over the past month, the MSCI US (-0.6%) has significantly under-performed the MSCI World ex-US (+3.5%), with this under-performance extending over the past twelve months; +13%y/y vs. +28.9%y/y.
Loss of perceived US exceptionalism leading to a moderation in equity-linked portfolio capital flows has the potential to remove what was a significant tailwind of support for the US dollar.
Narrowing US-RoW yield differentials and loss of US exceptionalism has the potential to significantly reduce the willingness of foreigners to finance the US current account deficit. As said, that deficit – which is driven by the US savings-investment imbalance – will be financed, but potentially at the expense of a significantly weaker US dollar.
And then there’s the elephant in the room.
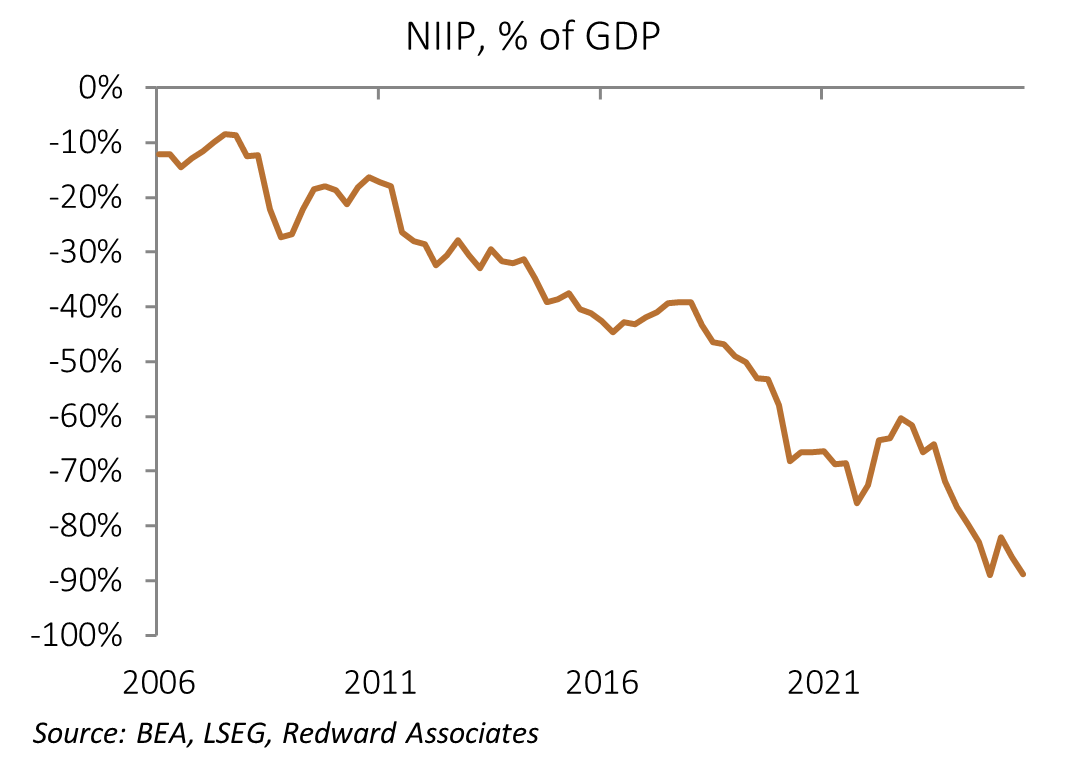
The US has run persistent, and at times large, current account deficits as a share of GDP for over forty years, leading to the accumulation of significant net international liabilities. And since the US dollar reached a trough in mid-2011, we’ve seen significant out-performance of US equities relative to the rest of the world coupled with a stronger US dollar, leading to substantial negative valuation effects (essentially, the value of foreign holdings of US assets in US dollars has grown significantly faster than US holdings of foreign assets converted back into US dollars). The combination of cumulative current account deficits and unfavorable valuation effects has pushed net US international liabilities to USD 27.61 trillion (-88.5% of GDP). This level of liability is on a par with the worst level experienced by Indonesia during the post-Asian crisis period.
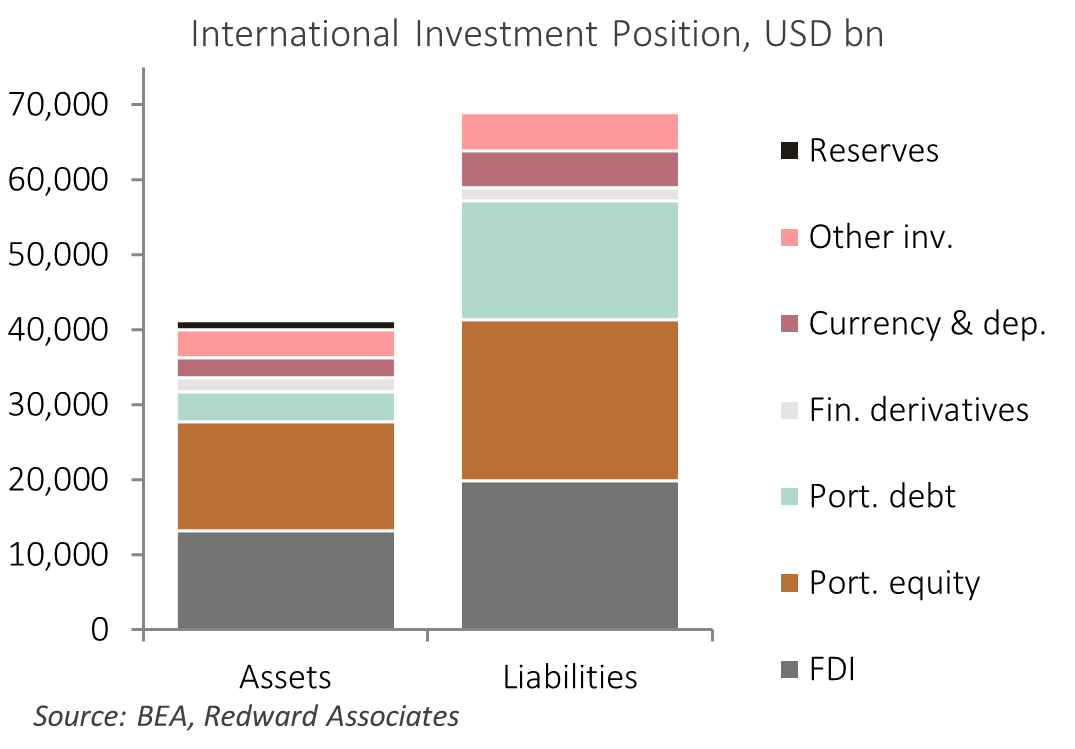
While the US net international liability is substantial, this is dwarfed by US gross liabilities. Gross liabilities amount to USD 68.89 trillion (221.5% of GDP). Of those, USD 15.8 trillion is portfolio debt, mostly in the form of US Treasury bond holdings (USD 7.83 trillion) with corporate and agency debt (USD 6.29 trillion) and Treasury Bill holdings (USD 1.42 trillion). However, this doesn’t fully capture the scale of debt holdings, with US currency and deposit liabilities (USD 4.85 trillion) and loans (USD 4.54 trillion) also substantial. Total debt-creating capital liabilities amount to a remarkable USD 29.25 trillion.
As former IMF Chief Economist, Maurice Obstfeld, noted in 2011 “recent experience shows however, that gross international asset and liability positions furnish the key conduit through which financial meltdown is transmitted and amplified”, suggesting that even if net positions are not large (they are), large gross liabilities can act as a conduit from loss of investor confidence to the exchange rate and on to asset markets, widening credit spreads, leading to selling of domestic assets (stocks) engendering a vicious cycle as investors attempt to liquify their portfolio.
A sudden stop appears unlikely…
While a period of under-performance of US assets and the US dollar would likely lead to a compression in the US net international liability, the size of the US gross international liability means that even a small shift in portfolio allocation away from US dollars and/or a shift in hedging ratio’s can cause tens of billions of US dollars in selling in the FX market.
However, as the US dollar is the global reserve currency and US asset markets are the deepest and most liquid, I believe the risk of a ‘sudden stop’ style crisis is unlikely. What strikes me as more probable is a rolling series of mini-crises weighing on the US dollar, interspersed with bouts of US dollar strength – likely in conjunction with an increase in asset market volatility/risk aversion – with foreign Central Banks acting to moderate dollar depreciation. In fact, I’d say that’s what we’ve seen over the past year, with Official Sector buying of US dollars evident across the Asia-Pacific region; in the cases of countries like India, Malaysia, Singapore, and Taiwan FX intervention has been overt while in countries such as China it’s likely been conducted by the Central Bank, with funds then swept to Sovereign Wealth Funds for asset management, while in Korea and Japan it’s been encouraged by Pension Fund purchases.
US dollar to continue weakening.
I project the US dollar to depreciate around 7% over the coming year against my 5-country US dollar basket. My projections are consistent with the US dollar weakening around 9-10% against the euro and yen, 6-7% against the Canadian dollar and Mexican peso, and about 5% against the renminbi.
The following content is for paid subscribers only.
If you would like to read this article, you can, for just US$ 15 for a one-month subscription, or US$ 150 p.a. That works out at about a dollar an article.
