

Gold: Scarcity matters.
In 2025, gold production climbed to a record, but structural headwinds to supply are intense, with profound implications for the price of gold in the long-term.

Record mine output in 2025…
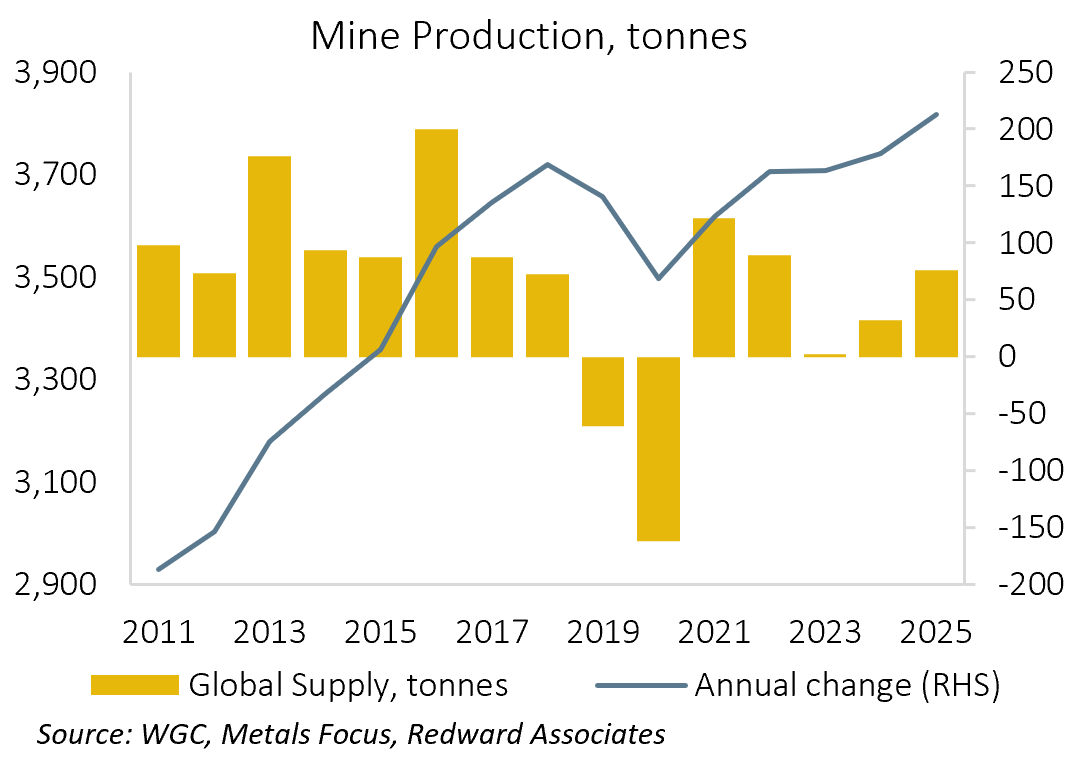
On the 9th of June, the World Gold Council (WGC) published its latest update on global mine supply by country. The WGC estimates that mine production in 2025 totaled 3,816.8t, up 2.0%YoY, the highest production on record with the accretion to production in line with its pre-pandemic pace.
…led by China
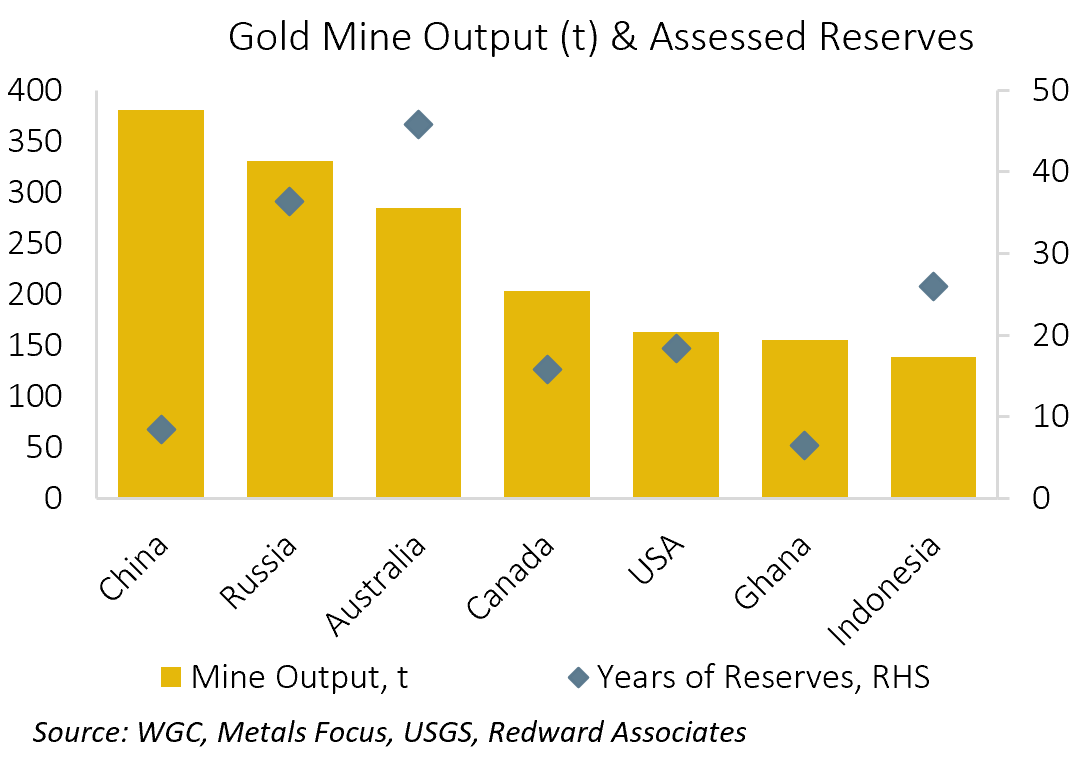
China retained its number one position, mining 384.3t (+1.1%YoY), with Russia second at 345t (+4.5%YoY), and Australia third, at 293.2t (+3.2%YoY). Meanwhile, US gold production slipped to 157t (-3.7%YoY), continuing its long-term trend decline.
However, while China remains the number one producer, the US Geological Survey estimates its reserves at 3,200t, well below those of Australia (13,000t), and Russia (12,000t). While China’s current pace of mining suggests it has only a little over eight years of assessed reserves, a country of its size is almost certain to contain undiscovered deposits, but to access them, China will need to increase its expenditure on prospecting and capital investment.
Data boosted by Artisanal mining.
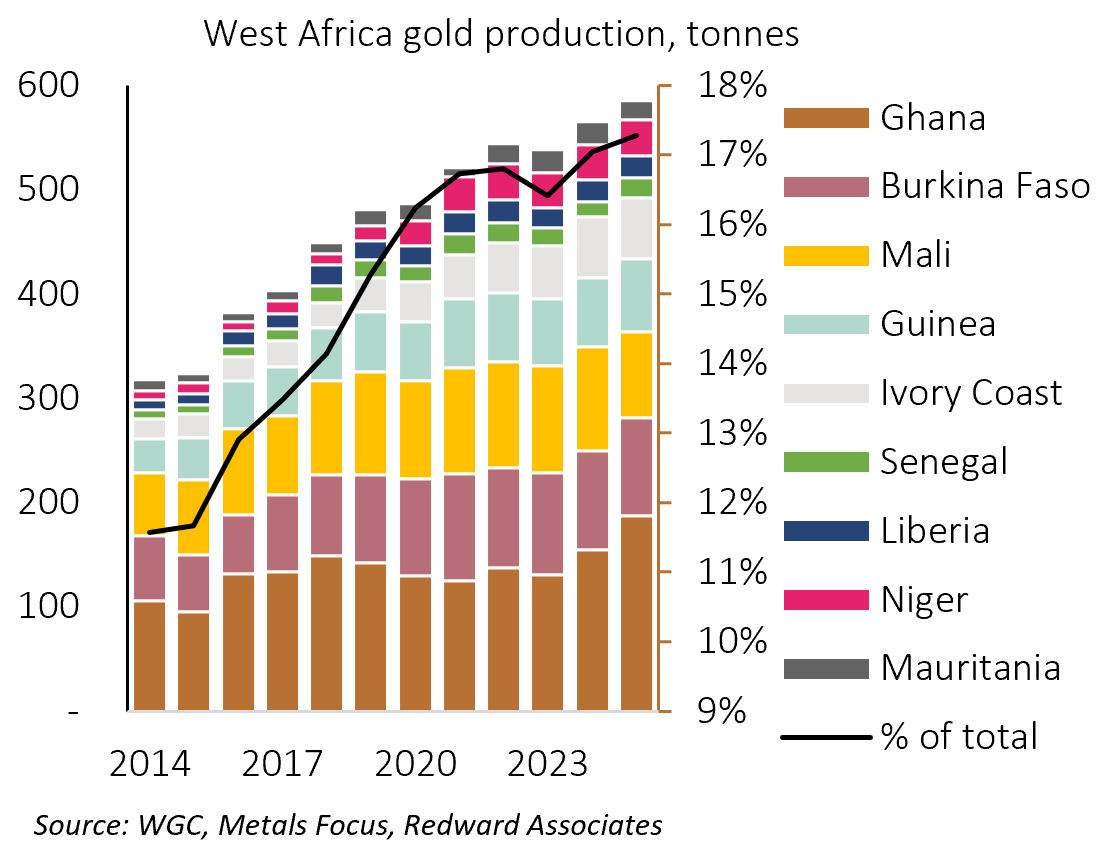
The WGC’s production data is compiled on their behalf by Metals Focus. While compiling data on production in developed markets such as Australia, Canada, and the United States is a straightforward exercise, merely tracking guidance from mining corporations, but compiling data in emerging and frontier countries is significantly more challenging. In some countries such as China and Russia, production is undertaken by large public or State-owned enterprises and data is likely to be available, albeit more difficult to obtain. But in some countries, notably those in Africa, where production is often undertaken by small-scale private or artisanal miners, it’s much more of a challenge.
Metals Focus have recently directed more effort to capturing Artisanal and Small-Scale Gold Mining (ASGM), leading to a substantial upward revision in mine production data, adding cumulative 621t to production since 2015. While the improvement data capture is welcome, and it will likely lead to an upward reappraisal of the total stock of gold holdings, it’s not clear it will coincide with an increase in the trend rate of growth in mine output, which is likely to remain anemic; since 2018, the pace of increase in mine production has averaged just 0.4% per-annum.
Structural headwinds are intense
In the short-term, miners can boost output by increasing use of variable cost inputs (e.g. labor) and by working existing assets harder, boosting capacity utilization. Over a multi-year period, production can be boosted by developing more marginal mining operations (e.g. re-processing old tailings, mining lower-grade ore, potentially also mining refuse. But in the long-run, production will ultimately be constrained by exploration and accretion to mining reserves.
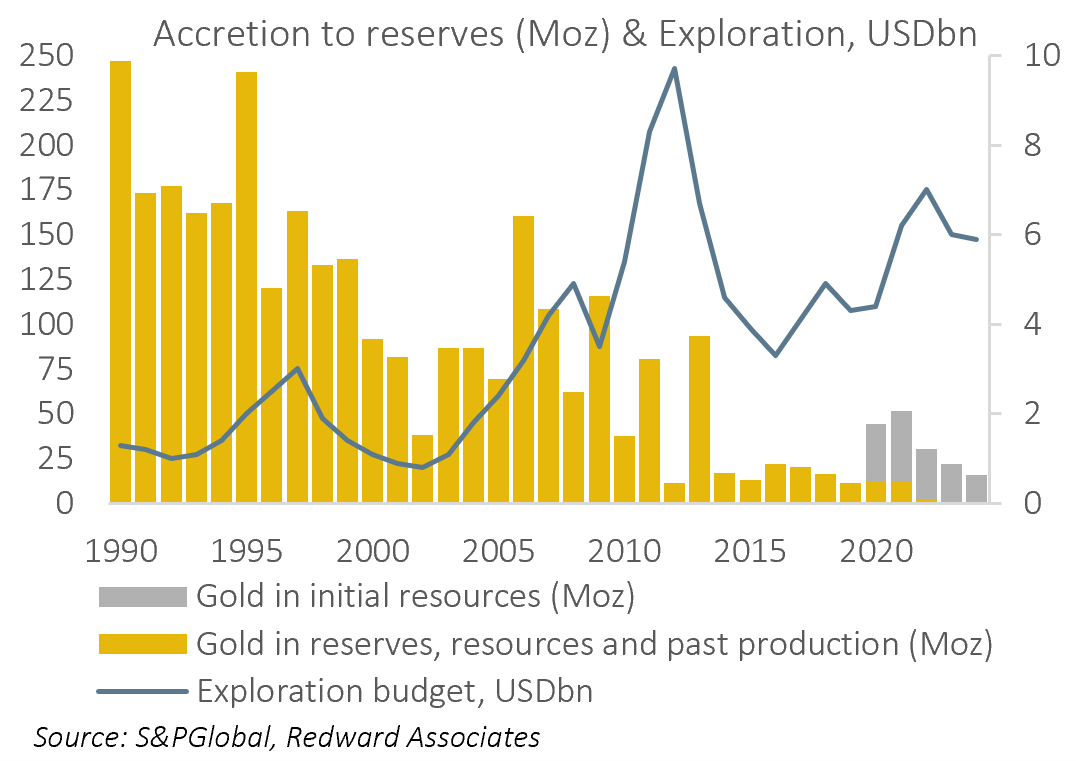
S&P Global noted last year (see new finds remain scarce despite gold from major discoveries at 3Boz, 29 July 2025) that while 3Boz in gold reserves, resources and past production have been identified since 1990, “no major discoveries occurred in 2023-24’ and “almost all new added assets were discovered decades ago.” S&P Global observe that in addition to becoming less common, new discoveries are also becoming smaller in size, “with the average discovery 4.4Moz in 2020-24, down from 7.7Moz in 2010-19.”
The decline in new gold discoveries is driven in part by miners becoming increasingly risk averse in their approach to exploration, preferring to allocate capital to the development of existing resources. The exploration budget peaked at USD 9.7bn in 2012, falling to just USD 5.9bn in 2024. In inflation adjusted (2024) dollars, the 2012 budget would be USD 13.25bn, implying a contraction in budget allocated to exploration of 55%.
The behavior of miners is understandable, as S&P Global estimates the implied discovery cost (USD/oz) has grown exponentially since the late 1990’s.
Below, I discuss the implications of slower supply growth, including a remarkable chart on its relationship to the price of gold.
The following content is for paid subscribers only.
I’m not brash in how I market my work. I enjoy writing these articles and I would like to think the work speaks for itself. If you enjoy my work, please consider a paid subscription, where you will receive my thoughts on trading ideas in precious metals.
If you would like to read this article, you can, for just US$ 15 for a one-month subscription, or US$ 150 p.a. That works out at about a dollar an article.
