


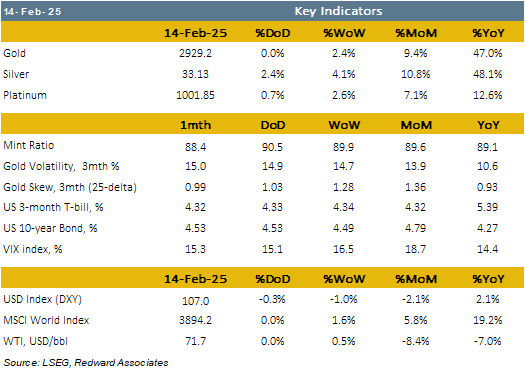
Gold rally extends for seventh week.
Gold appears to be technically over-bought, but elevated economic uncertainty is driving safe-haven demand for the metal and we are now seeing retail participation through gold-backed ETFs.

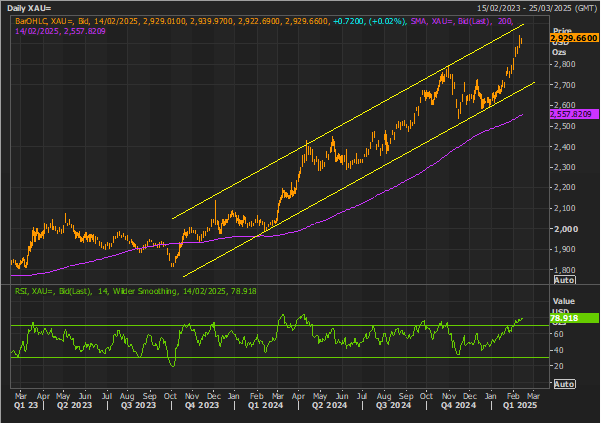
Gold looks set to close its seventh consecutive week higher, but technical indicators suggest the metal is becoming ‘over-bought’.
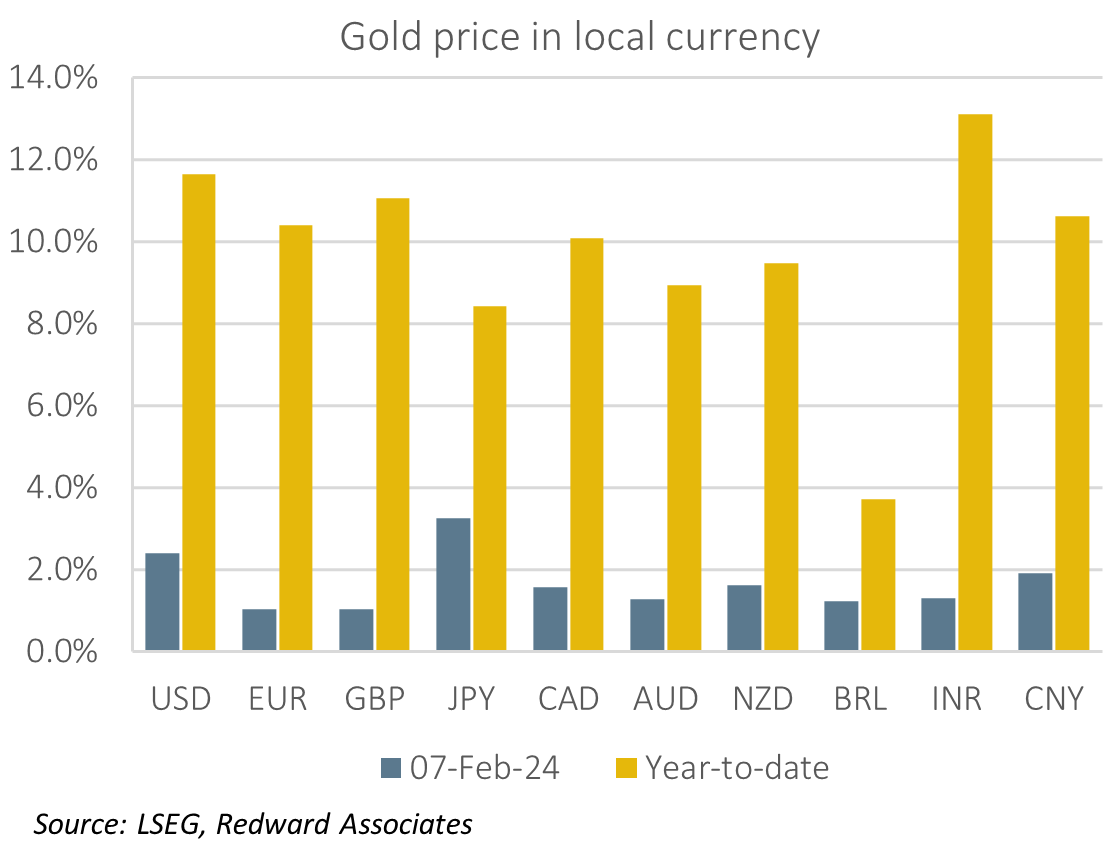
On a currency basket basis, gold has rallied 10.9% year-to-date and 51.2%YoY, with the metal strengthening percentage point-for-point with the S&P500 index since end-2022.
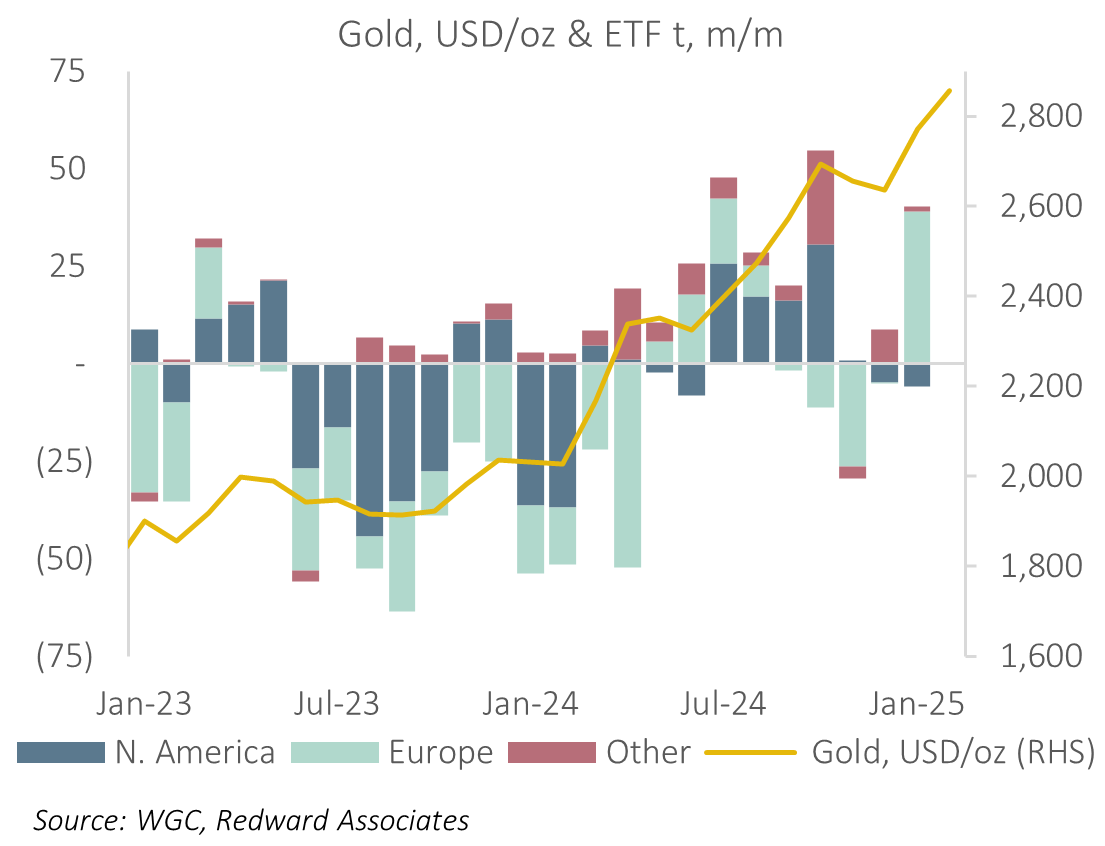
The rise in the price of gold is leading to renewed appetite for gold-backed ETFs, notably from European and Chinese investors.
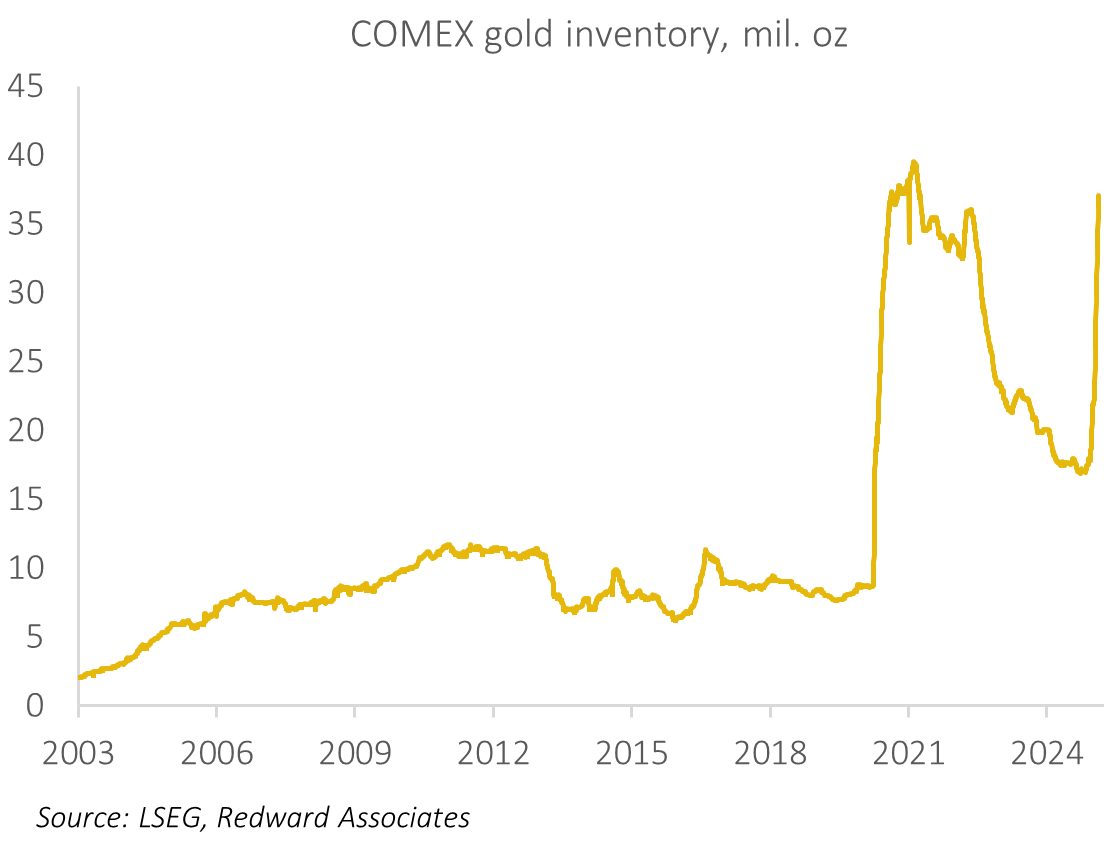
Gold continues to flow into COMEX approved warehouses, with reported inventory rising 471.4t year-to-date. We believe the COMEX demand story has legs and will continue to impact the gold market through mid-year at least.
The primary driver of demand for gold remains economic uncertainty. Given events in the United States, this doesn’t look like abating any time soon.
Despite the surge in the price of gold, the OTC options market remains subdued.
Gold appears technically over-bought amid robust sentiment
Gold remains in the up channel that commenced in late 2023, with the top of this channel now USD 3,000/oz. However, technical indicators on both a daily and weekly basis suggest gold has become ‘over-bought’ and if it closes this week above USD 2,862/oz, which appears likely, this will represent the seventh consecutive week of price gains; an unusually long winning streak.
While there are good reasons to be optimistic about the outlook for the metal, I believe sentiment is now becoming exuberant, with the rally firmly in the minds of the broader investing community. Should we see a pull-back in gold, technical support appears to be around USD 2,860/oz, with deeper support around USD 2,775/oz, where I anticipate longer-term buyers would step in.
Gold is rallying across-the-board
While investor focus is primarily on the price of gold in US dollars, what matters is it’s global price. There are many different approaches that can be used to create a basket price, but my preference is to construct one based on GDP weights at Purchasing Power Parity for the G-20 countries (ex-Russia). On this basis, gold has strengthened 10.9% year-to-date (51.2%YoY), this compares with a gain of 11.6% year-to-date (46.2%YoY) on a US dollar basis. And since the end of 2022, the price of gold is up 69.2% on a basket basis and 60.6% against the US dollar, almost identical to the S&P500 (58.9%).
Gold-backed ETF demand appears to be picking up
The World Gold Council (WGC) report gold-backed ETF holdings rose 34.5t in January, to 3,253.3t. Holdings in North America slipped to 1,644.6t (-5.9t) while those in Europe surged to 1,326.7t (+39.1t) with Asian holdings steady at 216.7t (+0.3t) and the rest of the world saw holdings lift to 64.3t (+1t). However, since the end of the quarter, we’ve seen a lift in Chinese gold-backed ETF holdings, with our estimate up 10.9t to 118.1t, month-to-date. ETF demand tends to be momentum driven, and with the rise in price now in the mind of the broader investor public, it’s likely we will see further interest, not only from China – where I see substantial scope for growth (HERE)- but in the US and Europe.
COMEX warehouses continue to draw gold in
Inventory held in COMEX approved vaults increased a further 18.7t yesterday, bringing the increase to 178.5t month-to-date, and 471.4t year-to-date. With COMEX prices continuing to trade at a premium to the LBMA spot market, and the backlog of demand to withdraw gold from London vaults (notably the Bank of England) still significant, it’s hard to see this surge slowing any time soon.
Some stories just have legs, this is one of them. This story is going to play out through at least the first half of this year.
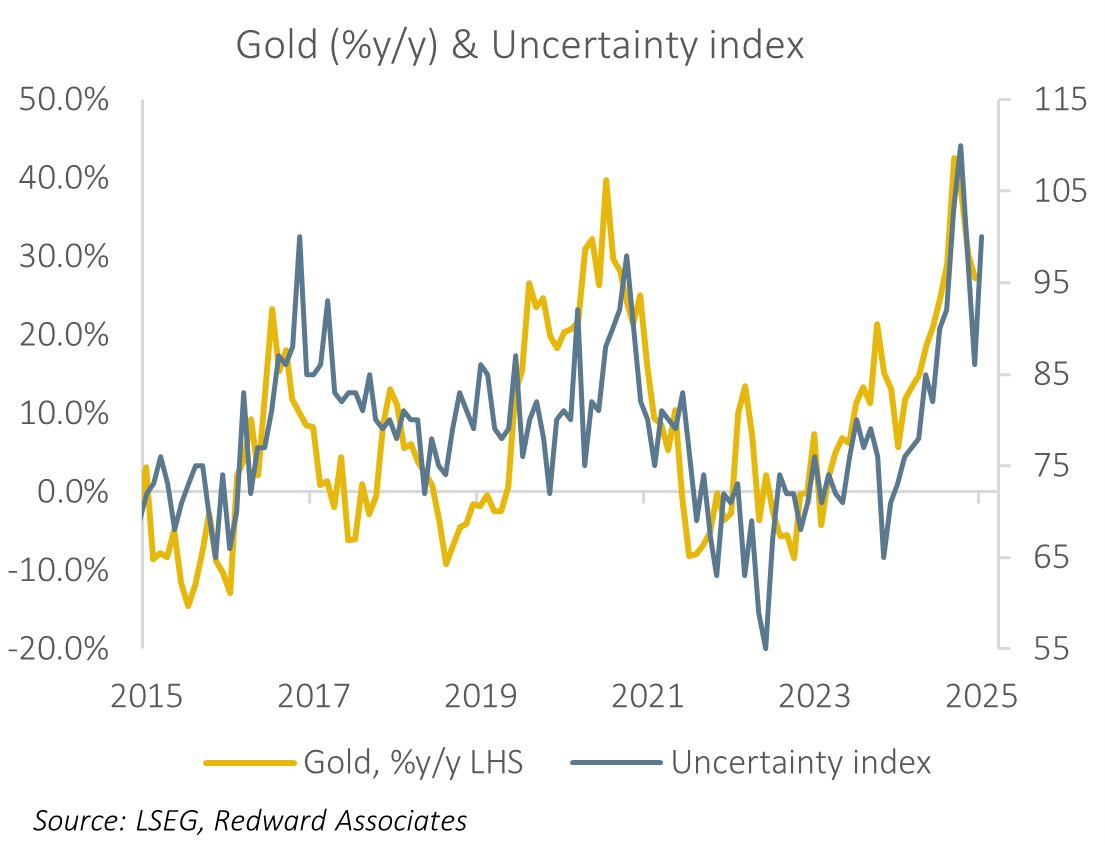
The key driver of gold demand remains uncertainty
The primary driver of demand for gold appears to be safe-haven appetite due to increased economic uncertainty.
The Policy Uncertainty Project has published a daily index of economic policy uncertainty since 1985. This index is constructed based on three components; news coverage about economic policy uncertainty, tax code expiration data, and divergence in economic forecasts. In the wake of President Trump’s inauguration we’ve seen a spike in policy uncertainty, peaking at the time of the threat of tariffs on Canada, China, and Mexico, but remaining elevated subsequently. As of yesterday, the index was 342, up from 109.5 end-2024. To put this into context, economic policy uncertainty is now at a similar level to the peak of the GFC, the European debt crisis, and the COVID-19 pandemic. Historically, a level of economic uncertainty of this magnitude, if sustained, is correlated to a rise in household savings, a slowdown in payrolls growth, a widening in corporate BBB bond yield spreads, a weaker stock market, and a rise in the price of gold.
NFIB’s January survey shows a similar story, with uncertainty surging to its second highest level in the past decade, behind only October 2024, with the rise in uncertainty consistent with a sustained rapid gain in the price of gold.
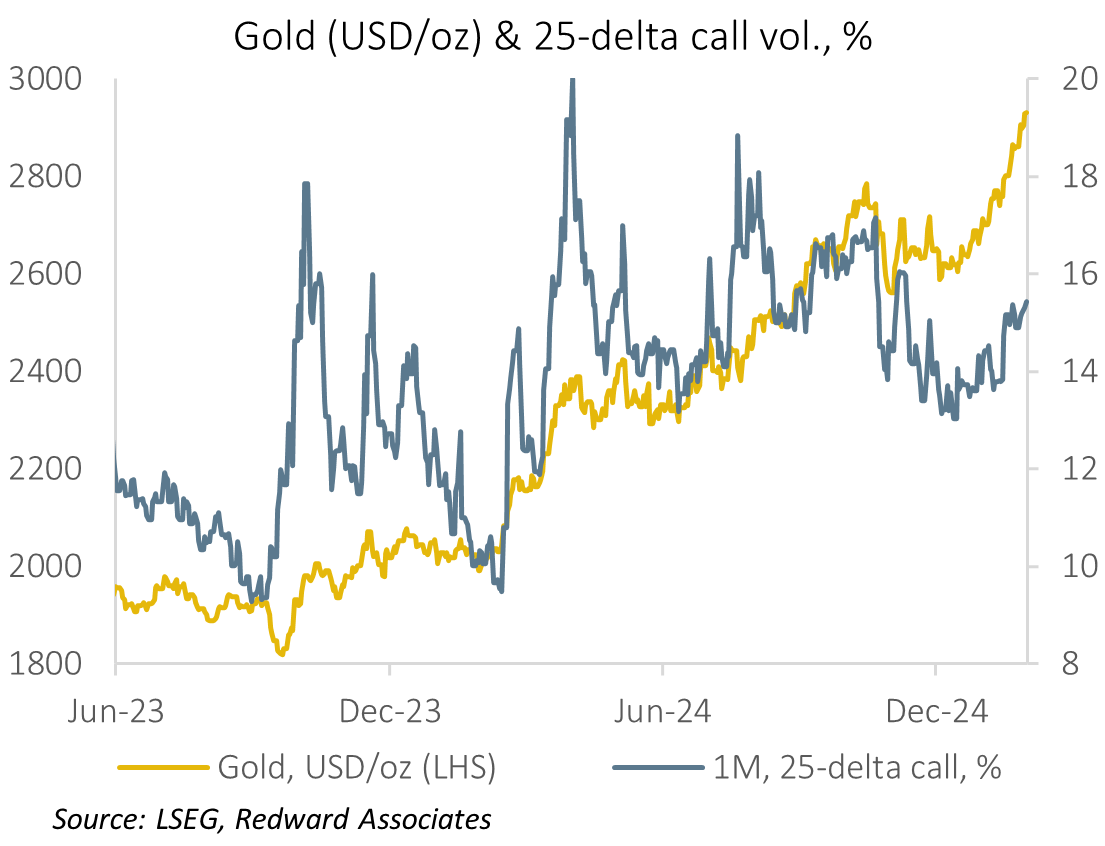
One thing that’s surprising to us…
What really surprises us about the current rally in gold is how remarkably calm the Over-The-Counter (OTC) gold options market is. Gold implied volatility has lifted slightly above its past year average across all tenors out to twelve months, with the implied volatility curve almost perfectly flat at 15%. Meanwhile, option volatility skew has recently declined, with one-month implied volatility skew falling to 0.65% and twelve months to 1.9%. Volatility skew is now below its past twelve months average across all tenors out to twelve months, with twelve-month skew the lowest in the past year.
Simply put, the OTC options market is not really buying into the rally. This lack of interest to participate in gold strength is important as it indicates that a significant portion of the investing community are either not significant participants in the move, or unwilling participants, suggesting that while sentiment may be bullish, positioning is less so. If we look at the price of gold relative to the option volatility on a one month 25-delta call option, we observe that over the past two years, a lift in the price of gold has typically been associated with a surge in volatility, not this time.
The information in this publication is provided by Redward Associates Private FZCO for informational purposes only. The insights contained in this publication are not investment advice and should not be construed as such, nor as a recommendation for any specific investment product. Our full disclaimer can be found HERE.